• Home
  • Courses
    • Paid
      • Data Analytics Accelerator Certification
      • Machine Learning With Python
      • Advanced Tableau Certification
      • Microsoft Power BI Certification
      • HR Analytics Certification
    • Free
      • Introduction to R Programming
      • Introduction to Python Data Science
  • Solutions
    • Corporate Trainings
    • University courses
    • Analytics Consulting
  • Products
    • Image Recognition Systems
    • Document Recognition and eKYC Systems
    • Cloud LMS Platform
    • Vehicle recognition API’s
  • About Us
    • Our Team
    • Blog
    • Events
  • Jobs
  • Contact Us
Have any question?
+91-97316 57840
contact@equiskill.com
RegisterLoginOld Users Login
Equiskill.comEquiskill.com
  • Home
  • Courses
    • Paid
      • Data Analytics Accelerator Certification
      • Machine Learning With Python
      • Advanced Tableau Certification
      • Microsoft Power BI Certification
      • HR Analytics Certification
    • Free
      • Introduction to R Programming
      • Introduction to Python Data Science
  • Solutions
    • Corporate Trainings
    • University courses
    • Analytics Consulting
  • Products
    • Image Recognition Systems
    • Document Recognition and eKYC Systems
    • Cloud LMS Platform
    • Vehicle recognition API’s
  • About Us
    • Our Team
    • Blog
    • Events
  • Jobs
  • Contact Us

Text Mining

  • Home
  • Blog
  • Text Mining
  • Sentiment analysis for new Moto G6

Sentiment analysis for new Moto G6

  • Posted by admin
  • Categories Text Mining
  • Date July 7, 2018

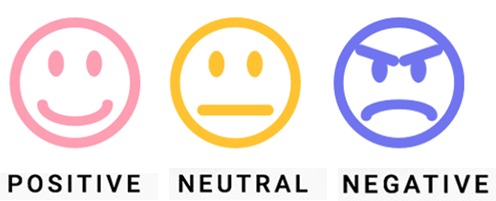
Sentiment analysis uses data mining processes to retrieve data for analysis from blogs, reviews, news, and social media to determine the consumer opinions about any product, service or brand.

Moto G6

We will be doing Sentiment analysis for customer reviews on Amazon for new Moto g6.

Step1:- We will create a text file for all the customer reviews. Just visit amazon.in and copy all the reviews for moto g6 in a text document.

Step2:- Remove all the unnecessary things as bullets, smileys and others manually and if some are left we will handle them later. This is how your text document will look like.

Step3:- Loading the packages                                                                         

we will now load all the required packages.

If anyone of these are not installed just install it using a simple command install.packages (“Package Name”).

Step4:- Reading the file                                                                                

we will now import our text document in Rstudio to further precede on it.

Copy the path of the text document into “reviews” variable. Then using readLines () function import this text document.

Step5:- Creating corpus                                                                                

we will now convert our text document to corpus. It is important to convert it into corpus format so that it can be easily processed by tm package.

Corpus is collection of all the text and documents regarding any content.

Step6:- Cleaning corpus                                                                               

we will now clean our corpus and remove other unnecessary things.

We will remove whitespaces, numbers, punctuation’s and stop words as they have no role in the analysis process.

Stop words are those words which are extremely common as “the, are, be, been…….” and many others and so we will remove them as they are not required.

Step7:- Term Document Matrix                                                                    

we will now create a term document matrix.

Term Document matrix is a simple mathematical matrix which tells us about the frequency of words in our corpus.

To convert a corpus into TDM use TermDocumentMatrix () function. Now pass it to as.matrix () to convert it to matrix form.

Step8:- Sentiment Analysis

We will now do the sentiment analysis of our TDM.

To perform sentiment analysis we will pass TDM to

get_nrc_sentiment () function.

Get_nrc_sentiment () function calculates the presence of different emotions and their corresponding valence in a text file.

Use ggplot () function to plot the graph.

This is how our plot will look like:-

  • Share:
author avatar
admin

Previous post

Twitter Sentiment Analysis
July 7, 2018

Next post

Word Cloud for new Moto G6
July 8, 2018

You may also like

7fd7f399-25fc-49dd-950b-c089b1977702
Word Cloud for new Moto G6
8 July, 2018
WhatsApp Image 2020-02-11 at 6.16.32 PM
Twitter Sentiment Analysis
6 July, 2018

Search

Categories

  • Data Science Queries
  • Regression
  • Text Mining
  • Uncategorized

Latest Courses

Data Analytics Accelerator Certification

Data Analytics Accelerator Certification

₹21,899.95
Machine Learning With Python

Machine Learning With Python

₹21,900.00
Data Science Using R

Data Science Using R

₹17,900.00 ₹14,900.00

Follow Us

Company

  • Our team
  • Alumni Speak
  • Contact Us

Trending Courses

  • Advanced Tableau Certification
  • Data Analytics Accelerator Certification
  • HR Analytics Certification
  • Machine Learning With Python

For Companies

  • Cloud LMS platform
  • Corporate Training
  • Hire skilled talent
  • New Hire Training

For Universities

  • Cloud LMS platform
  • Credit Courses
  • Credit Courses
  • Credit Courses

Copyrights © 2022 | Equiskill Insights, All Rights Reserved.

  • Privacy
  • Terms

Login with your site account

Lost your password?

Not a member yet? Register now

Register a new account

Are you a member? Login now